Trace sampling with OpenTelemetry: head or tail, and what each one costs you
Keeping every trace gets expensive. How head and tail sampling differ in OpenTelemetry, when to combine them, and when not to sample at all.
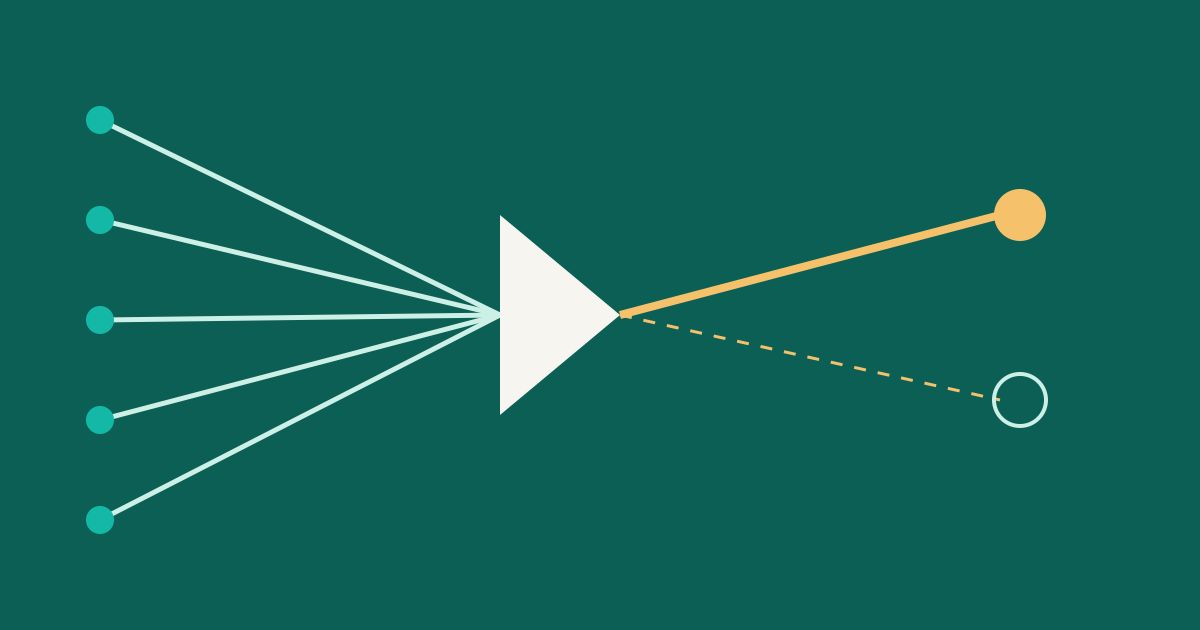
Tracing every request is wonderful until the bill or the storage graph arrives. At some volume, you have to keep a fraction of your traces. The real question is which fraction, and who decides.
OpenTelemetry names the two main answers head sampling and tail sampling. This post compares them, using the OpenTelemetry sampling documentation as the reference.
First, do you need to sample?
Not always. The docs list cases where it is reasonable not to: you generate very little data (tens of small traces per second or fewer), you only use the data in aggregate, or rules require you not to drop data. Sampling has a cost of its own, in compute and in the ongoing effort of maintaining rules. If your volume is small, keep everything and enjoy the simplicity.
Head sampling: decide at the start
Head sampling makes the keep-or-drop decision as early as possible, before the trace is complete. The common form is consistent probability sampling: the decision comes from the trace ID and a target percentage, so all services in one request agree and whole traces are kept or dropped together.
Strengths:
- Easy to understand and configure.
- Cheap, because dropped traces are never built, sent or stored.
- Works anywhere in the collection pipeline.
The limit is built into the idea. The decision is made before anyone knows how the request went. As the docs put it, you cannot guarantee that every trace containing an error is kept. If one percent of requests fail and you keep ten percent of traces at random, you keep ten percent of your failures, which is the reverse of what you want when debugging.
Tail sampling: decide at the end
Tail sampling waits until all or most spans of a trace have arrived, then decides. Now the rules can use what you actually care about:
- Keep every trace with an error.
- Keep every trace slower than some threshold.
- Keep traces with a particular attribute, such as a premium customer or a specific endpoint.
- Keep a small random share of the rest as a baseline.
That is far more useful for diagnosis, and the docs say that for large systems that must sample, tail sampling is almost always necessary.
The price is operational. Someone has to hold spans in memory until traces finish, which makes the component stateful and potentially heavy. The docs mention large data volumes, possibly dozens or hundreds of nodes, and note it may fall back to simpler techniques when overloaded. Rules also need updating as your system changes.
flowchart LR
    S1[Service A] --> C[Collector tier]
    S2[Service B] --> C
    S3[Service C] --> C
    C -->|"all spans of a trace, buffered"| T{Tail rules}
    T -->|error or slow| K[Keep]
    T -->|baseline 5%| K
    T -->|otherwise| D[Drop]
    K --> B[(Trace backend)]
Note
Tail sampling only works if all spans of one trace reach the same decision-maker. With several collector instances, spans must be routed by trace ID, so that one instance sees the whole trace. This is a general requirement of the approach, so plan the routing before the rules.
Combining them
The two are not rivals. The docs describe a common pairing: a high-volume service applies head sampling first, to protect the pipeline from raw volume, and tail sampling happens before export to choose the interesting traces from what remains.
A sensible way to think about it:
| Question | Head | Tail |
|---|---|---|
| Decides when? | At the start of the trace | After most spans arrive |
| Can keep all errors? | No guarantee | Yes, with a rule |
| Needs buffering? | No | Yes, stateful |
| Operating effort | Low | Higher |
| Good first step? | Yes | Once volume demands it |
A sketch of tail rules
The OpenTelemetry Collector ships a Tail Sampling Processor and a Probabilistic Sampling Processor. The exact fields depend on your collector version, so treat this as a shape to adapt, not a file to paste:
processors:
  tail_sampling:
    decision_wait: 10s
    policies:
      - name: keep-errors
        type: status_code
        status_code: { status_codes: [ERROR] }
      - name: keep-slow
        type: latency
        latency: { threshold_ms: 2000 }
      - name: baseline
        type: probabilistic
        probabilistic: { sampling_percentage: 5 }
The wait time is a trade-off. Too short and you decide before slow spans arrive; too long and you hold more data in memory.
Practical advice
- Start with no sampling or simple head sampling. Let real volume tell you when you need more.
- Always keep errors and slow requests once you move to tail rules. They are the traces you open at 3 a.m.
- Keep a random baseline. Without ordinary traces, you cannot tell what normal looks like.
- Compute metrics before sampling. Counts, error rates and latency histograms should come from all requests, not from the sampled subset, or your dashboards will lie.
- Watch the sampler itself. Track its memory, dropped-span counts and decision delays.
- Write the policy down. A short decision record, like those in our post on architecture decision records, saves the next engineer from wondering why traces for some endpoint vanish.
Where this leaves you
Sampling is a cost-control tool, and like most of those it works best when it is boring: a few clear rules, measured, with errors protected. Begin with the simplest approach that fits your volume, and move to tail sampling when the question "where is the failing trace?" starts going unanswered.